Latest Update: A Bivariate Ordinary Least Squares Calculator
So, for the latest update to this site, I've dusted off some of my old stats textbooks and written a simple calculator to do an Ordinary Least Squares calculation and plot the result on a graph.
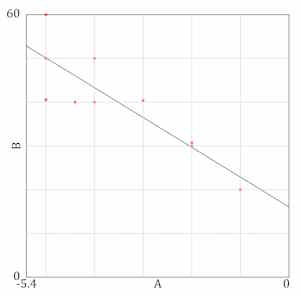
For those who aren't mathematically inclined that basically means taking a bunch of data and calculating a best fit equation based on that data using a method called Ordinary Least Squares. The overall result gives you something like this.
This little app was written using Typescript and Angular 17, I wrote my own libraries to calculate things like Variance and CoVariance so on, I needed a bit of a refresher on the subject because it's a while since I last did any serious statistics based work so I'm also thankful for Ben Lambert's videos on OLS.
Published on 09:14:31 14 Apr 2025